
The platform
Every decision, captured. Every gap, explained.
Every clinical decision your HCPs make, captured with the reasoning behind it and scored against your objectives.
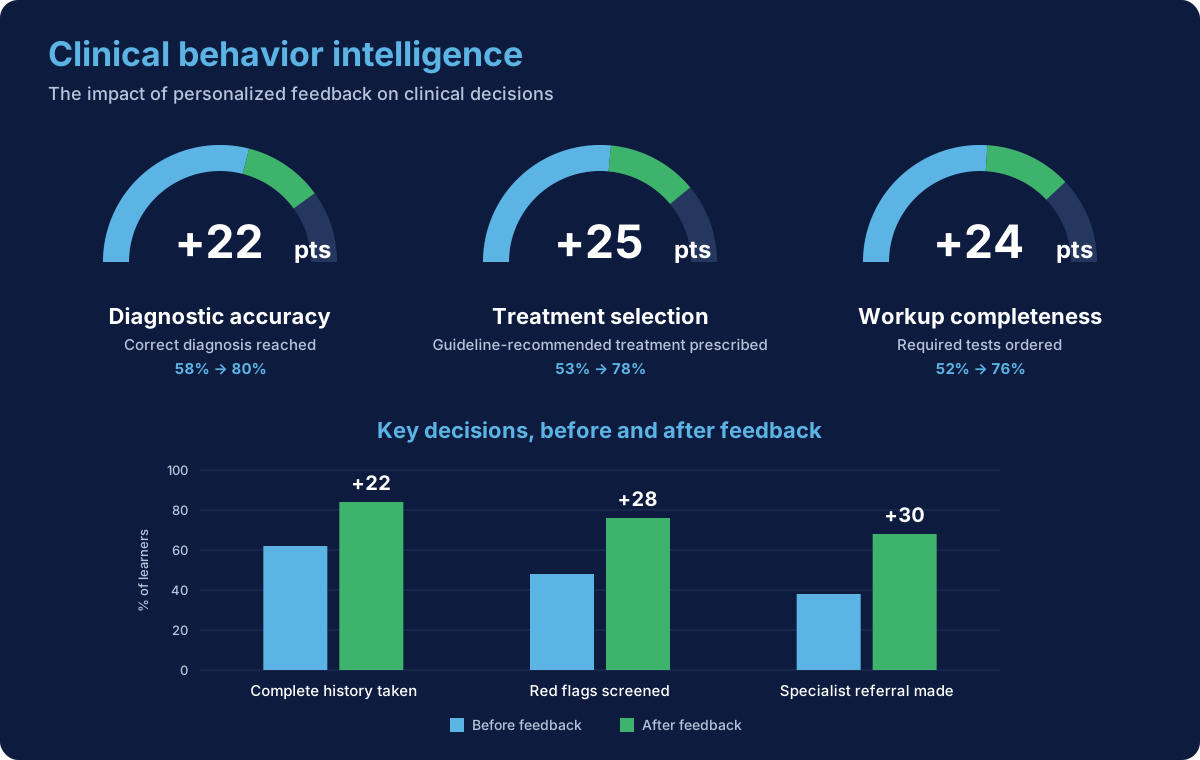
What the dashboard shows
Each chart compares an HCP's first decision with the decision they make after in-case feedback. Sample data: one live oncology program, one cohort.
The actions they took
The case: a patient on treatment develops a new symptom. Progression, infection, or a side effect of the treatment itself.
Where decisions within the case diverge from guidelines, and how they change after feedback.
Before feedbackAfter feedback
Required workup ordered before deciding+29 pts
Therapy held or adjusted on suspicion+29 pts
Correct dose selected+35 pts
Urgent referral made when indicated+31 pts
0%50%100%
The choices they made
One decision point in full. Where a message lands, and where adoption stalls.
Which options HCPs choose, and how those choices change after feedback.
Before feedback
After feedback
- The recommended option33% → 71%
- Default escalation37% → 10%
- A partial measure16% → 12%
- A more aggressive alternative10% → 5%
- No change4% → 2%
The reasoning behind them
Every decision carries its rationale, in the HCP's own words. Which message pulled through, and which barrier is real.
Whether the right choice was made for the right reason, and what the real barrier is when it was not.
68-85%
of those choosing the recommended option cite the guideline, or a specific patient factor.
58-78%
of those choosing an alternative cite familiarity, or efficacy alone.
The reasons captured
- Following the guideline
- Efficacy
- Patient barriers and tolerability
- Risk of interactions
- Familiarity with the option
- Cost and patient access
Ranges across programs in type 2 diabetes, HIV and NSCLC.
The conversation itself
HCPs question the patient in free text. The goals are scored from what they ask, not from what they order, including empathy and shared decision-making.
What they ask the patient, and what they leave out.
Cohort average 72%Below the average
Assessed across 11 communication dimensions and 5 competency domains, with no manual grading. Cohort averages shown; individual reports also available.
Captured in every case
Decisions
Every diagnosis, prescription, dose, hold and referral, scored against your objectives.
- Guideline implementation gaps
- Treatment and prescribing patterns
- Safety and risk behavior
Conversations
The free-text interview, scored across 11 communication dimensions.
- Disease and risk awareness
- Unmet need, in their own words
- 5 competency domains
Content exposure
Which references and materials HCPs opened, and whether they subsequently revised their decisions.
- The decision point that triggered it
- Time on the page, not just the click
- Whether the decision was then revised
- What was surfaced and skipped
Engagement
Who took part, through which channel, and how far they got.
- Reach and completion
- Channel performance
- Message pull-through
One dataset. Five teams' questions.
The same case produces the evidence each function is already asked to report.
Medical Affairs
- Disease awareness lift
- Guideline implementation gaps
- Unmet need, evidenced
- Safety management
Commercial
- Brand differentiation lift
- Message pull-through
- Leading indicators
- Field-ready insight
- Next best action
CME / CPD
- Moore's Level 4 outcomes
- Learning objective attainment
- Competency gap closure
Medical Associations
- Guideline adoption
- Where the pathway breaks
- Practice variation
- Member competency
Health Systems
- Practice variation
- Protocol adherence
- Onboarding readiness
- Quality and safety